
Zabbix
Zabbix 8.0 LTS under the hood: the engine behind the new generation of monitoring
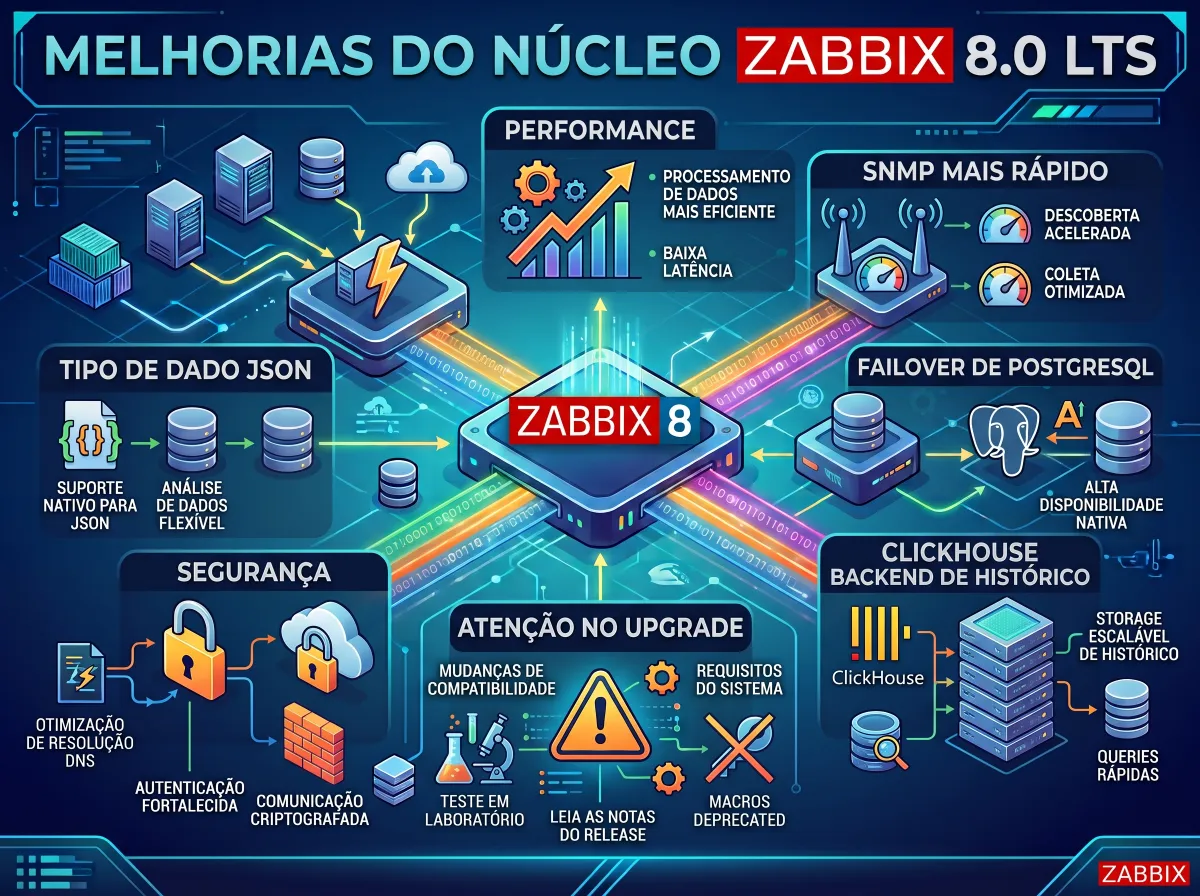
In the first article of this series, we talked about the novelties in Zabbix 8.0 that draw the most attention: OpenTelemetry, logs, complex event processing, and native integration with AI agents. But none of these ambitions holds up without a core able to bear the load. Traces, logs, and structured payloads multiply the volume of data. Event correlation in time windows demands fast processing. And a platform that proposes to be the center of operations needs to be as available as the systems it watches.
This second article is about that core. Performance and scalability, high availability, new data types, the new history storage model and, finally, a part that tends to be left out of summaries of novelties but decides the success of a project: what changes in an incompatible way and needs to be prepared before the upgrade.
Feature status. Unlike the observability and AI block, much of what is in this article already appears in the official 8.0 documentation and in the published alpha and beta versions: ClickHouse, the JSON data type, support for multiple PostgreSQL hosts, SNMP and DNS cache improvements, among others. The exceptions are the “massive performance improvements,” still marked as in development on the roadmap, and the permissions for proxies, which are in testing with a forecast for the release candidate. The documentation consulted is that of the development version and may change until the launch, planned for October 2026.
Performance and scale: toward a million values per second
The 8.0 roadmap promises massive performance improvements, with the ability to collect millions of values per second, thanks to a much more efficient Zabbix Server and flexible support for storage engines designed for large-scale deployments. At Zabbix Summit 2026, Zabbix’s Lead Product Owner has a talk dedicated exactly to showing how the new 8.0 features make it possible to reach 1 million new values per second (NVPS). To size the leap: one of the cases presented at the same event is that of a Finnish carrier running a highly available architecture with about 2,500 hosts and approximately 7,000 NVPS. Much larger environments than that exist, but the order of magnitude shows that 8.0 aims at a level few installations reach today.
It is important to separate here what is promise from what is already in the code. The massive improvements item is still in development. The optimizations that attack known day-to-day bottlenecks, on the other hand, are documented, and they are the ones that will make a difference first for most companies.
The first is in SNMP, the protocol that remains the backbone of network monitoring. In SNMPv3, Zabbix now caches and reuses the devices’ EngineID, avoiding the discovery step on every query. The original request for this improvement was opened in the community in 2014 and is finally delivered in the 8.0 cycle. In addition, SNMPv1 and SNMPv2 checks are now processed concurrently. For an internet provider or a carrier monitoring thousands of switches, routers, OLTs, and radios, this means fewer busy pollers, less queueing, and shorter collection intervals with the same hardware. And for those who migrated to SNMPv3 due to a security requirement and felt the impact on performance, it is an old debt being paid.
The second is name resolution. Server, proxy, and agent can now use the c-ares library for all DNS requests, with query caching and failover between resolvers. It seems like a detail, but anyone who has administered an environment with thousands of hosts registered by name knows what happens when DNS gets slow or unstable: an avalanche of “unreachable” hosts that looks like a network failure and is not. With caching and automatic resolver switching, an entire family of false positives simply disappears. It is the kind of improvement nobody notices until the night it prevents a phantom incident.
Completing the package are a faster server startup, with batch history loading, optimized housekeeping, performance improvements in the use of Elasticsearch, and fine tuning of the throughput control of proxies during history cache recovery. This last point is relevant for those who operate distributed environments: when a proxy stays disconnected for hours and comes back with a full buffer, it cannot drown the server in delayed data. Refining this mechanism makes recovery from connectivity incidents more predictable.
ClickHouse: when the relational database is no longer enough
If there is a universal pain among Zabbix administrators in large environments, it has a name: the size of the history tables. Partitioning, TimescaleDB, housekeeping tuning, aggressive retention: everyone who operates Zabbix at scale has been through this fight. 8.0 brings a structural answer: ClickHouse can be used as a backend to store item value history.
ClickHouse is a columnar database designed for analyzing large volumes with high compression and very fast aggregate queries. In Zabbix 8.0, it stores the integer and float numeric, character, log, text, and the new JSON types. But there are architecture details that need to be understood before any decision, and the official documentation is clear about them. Zabbix does not calculate or store trends in ClickHouse, which means the retention strategy needs to be rethought, possibly extending the history period. The Zabbix housekeeper does not delete data in ClickHouse; retention is controlled by the database’s own TTL, which is 31 days by default. ClickHouse is not supported on proxies. And in clusters with replication and sharding, Zabbix’s configuration accepts only one URL, which is why the recommendation is to put a load balancer in front of the nodes.
Along with this delivery comes a change of model that goes beyond ClickHouse. The old external history storage parameters give way to a new parameter, HistoryProvider, on the server, and to the $HISTORY_PROVIDERS variable in the frontend. In practice, history stops being “the Zabbix database” and becomes a pluggable provider, which can be SQL, Elasticsearch, or ClickHouse, even with different value types going to different destinations. Those who already use Elasticsearch as a backend will also be affected by this configuration change. Zabbix also publishes scripts to migrate existing history from MySQL or PostgreSQL to ClickHouse.
The most obvious usage scenario is large environments, with millions of items and a need to keep raw history for longer, whether due to a regulatory requirement or for analysis. Another interesting scenario is that of those already thinking about feeding anomaly detection models or AI agents with Zabbix data: a columnar database is much better suited to heavy analytical queries than a transactional one. But ClickHouse is not a silver bullet. It introduces a new technology into operations, with its own requirements for sizing, backup, monitoring, and technical knowledge. For many mid-sized environments, a well-tuned PostgreSQL with TimescaleDB remains the simplest and sufficient choice. Summit 2026 brings a talk and an entire workshop on the topic, which shows the weight Zabbix gives to this change.
JSON as a native data type
Up to version 7.4, a JSON returned by an API was collected in a text-type item, stored as a string, and limited to 64 KB. In 8.0, JSON becomes a first-class data type, with a limit of 128 MiB and validation: values with unquoted keys, extra commas, or unbalanced brackets are rejected instead of being written as silent garbage. The type is supported by all item types and prototypes, except calculated ones, and also appears in real-time export and streaming connectors.
There is a restriction that summaries usually omit and that changes how you model: JSON-type items cannot be used directly in triggers. To alert on a specific field, the path remains extracting the value with a dependent item of another type. In addition, both ClickHouse and Elasticsearch do not accept JSON arrays at the root; the value must be an object or a set of objects. In other words, native JSON changes where the volume is stored, not how you alert.
Where does this make a difference? In all API-based monitoring, which grows with every version. Kubernetes clusters, cloud providers, hypervisors, next-generation firewalls, SaaS platforms: all respond in JSON, often with payloads that went well past 64 KB. Today, the common solution is to slice the response in preprocessing and discard the rest. With the JSON type, the complete object stays available for investigation, auditing, and reprocessing. And, connecting with the first article of this series, it is exactly this kind of structured and complete data that makes a query made by an AI agent via MCP more useful.
In the same modeling vein, 8.0 brings improvements that seem small but were long-standing community requests. Tags defined in templates and hosts become visible in the items and triggers that inherit them, tags of triggers created by low-level discovery can be edited manually, and nested LLD gains macro support. As we saw in the previous article, well-modeled tags will be the basis of complex event processing, and these changes make the data model more transparent and controllable.
High availability: the database stops being the weak link
Zabbix has had native server high availability since version 6.0 and proxy groups with load balancing and failover since 7.0. The link that remained fragile was the database. Many companies already run PostgreSQL in a cluster with tools such as Patroni, but Zabbix accepted only a single database address in the server and frontend configuration. For database failover to be transparent, a virtual IP, an HAProxy, or some other component had to be placed in the middle.
8.0 solves this with support for multiple PostgreSQL hosts. The original request, opened in the community in 2021, described exactly the Patroni cluster scenario: allow Zabbix to know several addresses and always connect to the active node in case of failover or switchover. The feature was delivered in beta1 and appears on the roadmap as automatic failover for the PostgreSQL backend.
The practical effect is one less piece in the architecture and one less point of failure. In a planned database maintenance scenario, the switchover happens without editing configuration files or depending on an extra network layer. In a real failure of the primary node, Zabbix finds the new primary on its own. The case of the Finnish carrier presented at the Summit, which combines Zabbix servers in HA, a PostgreSQL cluster managed by Patroni on physical servers, and six proxy groups, is a portrait of the kind of architecture that becomes simpler to build and operate with 8.0.
Security and governance: Zabbix as a multi-user platform
A set of 8.0 changes points to environments where Zabbix is shared among several teams, business units, or customers. The most relevant is the new permission model for proxies and proxy groups, similar to what already exists for host groups. The request was born from managed service providers that needed to prevent one customer from seeing or choosing other customers’ proxies. The feature is in testing, with a forecast for the release candidate.
Other deliverables reinforce the security posture: SAML certificates can be uploaded directly through the interface for single sign-on, integration with the HashiCorp Vault secrets store gains authentication through the AppRole method, the audit log can be exported to CSV from filters, and agents gain the AllowKeyRegexp and DenyKeyRegexp parameters to control, by regular expression, which keys can be executed. HTTP-based templates and media types now verify the destination’s TLS certificate by default, which is safer but may break integrations that point to endpoints with self-signed certificates.
For a public agency that needs to prove in an audit who changed what, for a bank that needs to demonstrate access controls, or for a provider that operates Zabbix for dozens of customers, this set of improvements turns practices that used to depend on discipline and scripts into native features.
The cost of the upgrade: what changes in an incompatible way
Every LTS version brings changes that break compatibility, and 8.0 is no exception. The first and heaviest is the raising of the minimum database and PHP versions. The minimum PostgreSQL goes from version 13 to 15, MySQL from 8.0.30 to 8.4, MariaDB from 10.5 to 10.11, TimescaleDB from 2.13 to 2.20, and PHP from 8.0 to 8.2. For many companies, this means that upgrading Zabbix starts with upgrading the database where all the history lives, and that tends to be the longest and riskiest stretch of the maintenance window. For those who use MySQL created with the utf8mb3 character set, the recommendation is to convert to utf8mb4.
The second change is in macros. 8.0 finally removes macros deprecated a long time ago that still survive in the notification texts of many environments, such as {HOSTNAME}, {IPADDRESS}, {TRIGGER.COMMENT}, {TRIGGER.KEY}, {STATUS}, {USER.ALIAS}, {PROFILE.*}, and the old acknowledgment macros {ACK.*}. All have replacements that already work in the 7.x versions. The risk here is silent: what breaks is not a chart, it is the alert text, and a broken alert is only noticed when someone needs it.
The third is in automation. The API loses the massupdate method on host, template, host group, and template group objects, in addition to hostinterface.replacehostinterfaces. Integration scripts with CMDBs, provisioning pipelines, and “Zabbix as code” tools need to be reviewed. In JavaScript preprocessing, the methods of native objects become read-only, which invalidates scripts that modified prototypes. In agents, the % character enters the UnsafeUserParameters list. The agent 2 Ceph plugin becomes a loadable plugin, with extra installation steps, and agents prior to version 1.6 are no longer supported.
There is also an operational detail that applies to any major version upgrade: Zabbix migrates the database schema when starting the new version, and that migration does not undo itself. Going back to the previous version means restoring the database. That is why a tested backup and a full rehearsal in staging are not bureaucracy; they are the rollback plan.
Why this matters now
The volume of monitoring data grows faster than infrastructure budgets. More APIs, more containers, more edge devices, and now more telemetry signals, such as traces and logs. Commercial observability platforms turned this volume into a billing model, and many companies discovered that the cost of storing and querying data became a relevant line in the IT budget.
Zabbix 8.0’s move is to prepare the core for this new scale without abandoning the open model: a more efficient server, faster network collection, pluggable history with an analytical database option, structured data types, and a high availability architecture with fewer pieces. It is less flashy than a new correlation engine or an MCP server, but it is what determines whether those novelties will work in each company’s real environment.
The expert’s view
The core and performance improvements show up less to the public than a new widget or a correlation engine, but they are as important as any feature. Without these infrastructure changes, the evolution of the tool simply would not be technically possible. Everything Zabbix 8.0 promises in observability and AI depends on a server able to process more data, on storage that can handle the volume, and on an architecture that does not stop.
On ClickHouse, I see the decision depending on two factors: the size of the database and the use of the new observability features. Large environments already have a good reason to evaluate the new history backend. But it is the adoption of logs, traces, and JSON API collections that will make migrating to ClickHouse something natural, because the volume and format of this data call for an analytical database. I still have an important question about trends: it was not clear whether, with history in ClickHouse, trends will be able to continue being kept in the traditional SQL database. This is a point we will need to see in practice, in the final version, before closing any architecture recommendation.
Support for multiple PostgreSQL hosts is a feature long awaited by administrators and DBAs. I have dealt with critical environments where DBAs refused to use high availability solutions such as Patroni out of insecurity about the behavior of Zabbix, an application that reads and writes at very high volume. Having Zabbix itself prepared to live with database failover changes that conversation. My expectations here are quite high.
The permissions for proxies and proxy groups solve a real difficulty of multi-tenant and distributed administration environments, in which different teams or customers share the same installation. It is one more convenience that becomes part of the core, instead of depending on conventions and external controls.
And on the upgrade, more than ever, it needs to be well tested, documented, and repeated until we are sure everything went right and nothing broke. Calm, a lot of testing, and patience. You have to control the anxiety of seeing all the novelties in production and work with a clear goal: no surprise can appear at the time of executing the change request.
Conclusion
Zabbix 8.0 does not only change what the platform shows, but how it withstands, stores, and protects data. Faster SNMP, resilient DNS, history in an analytical database, native JSON, transparent PostgreSQL failover, and a permission model designed for shared environments form the foundation on which the observability and AI novelties will run. At the same time, the raising of database requirements, the removal of macros, and the API changes make this an upgrade that deserves planning.
In the next article, we move to the layer everyone sees: the new frontend, the widgets, the user experience, and Zabbix’s official mobile app.
Sources
- Zabbix Roadmap (official)
- What’s new in Zabbix 8.0 — official documentation (development version)
- ClickHouse setup — official 8.0 documentation
- Zabbix Server 8.0 configuration parameters
- ZBXNEXT-6492 — Multiple PostgreSQL hosts / Patroni
- ZBXNEXT-2352 — SNMPv3 EngineID caching and reuse
- ZBXNEXT-9185 — Permissions for proxies
- Zabbix Summit 2026 — agenda
About Target Solutions
Target Solutions has spent more than 15 years helping organizations evolve their infrastructure, monitoring, observability, automation, and operational intelligence operations. Across that journey, it has participated in projects in complex environments such as telecom, technology, government, energy, and large enterprises, helping increase operational efficiency and service reliability. As a Zabbix Certified Partner in Brazil, Target Solutions supports the deployment, evolution, sustainment, and optimization of enterprise Zabbix environments, integrating monitoring with ITSM, observability, and operational processes at scale.
About the author
Luciano Souza, Associate Consultant at Target Solutions.