
Internet of Things (IoT)
IoT monitoring and IT monitoring: what changes in practice?
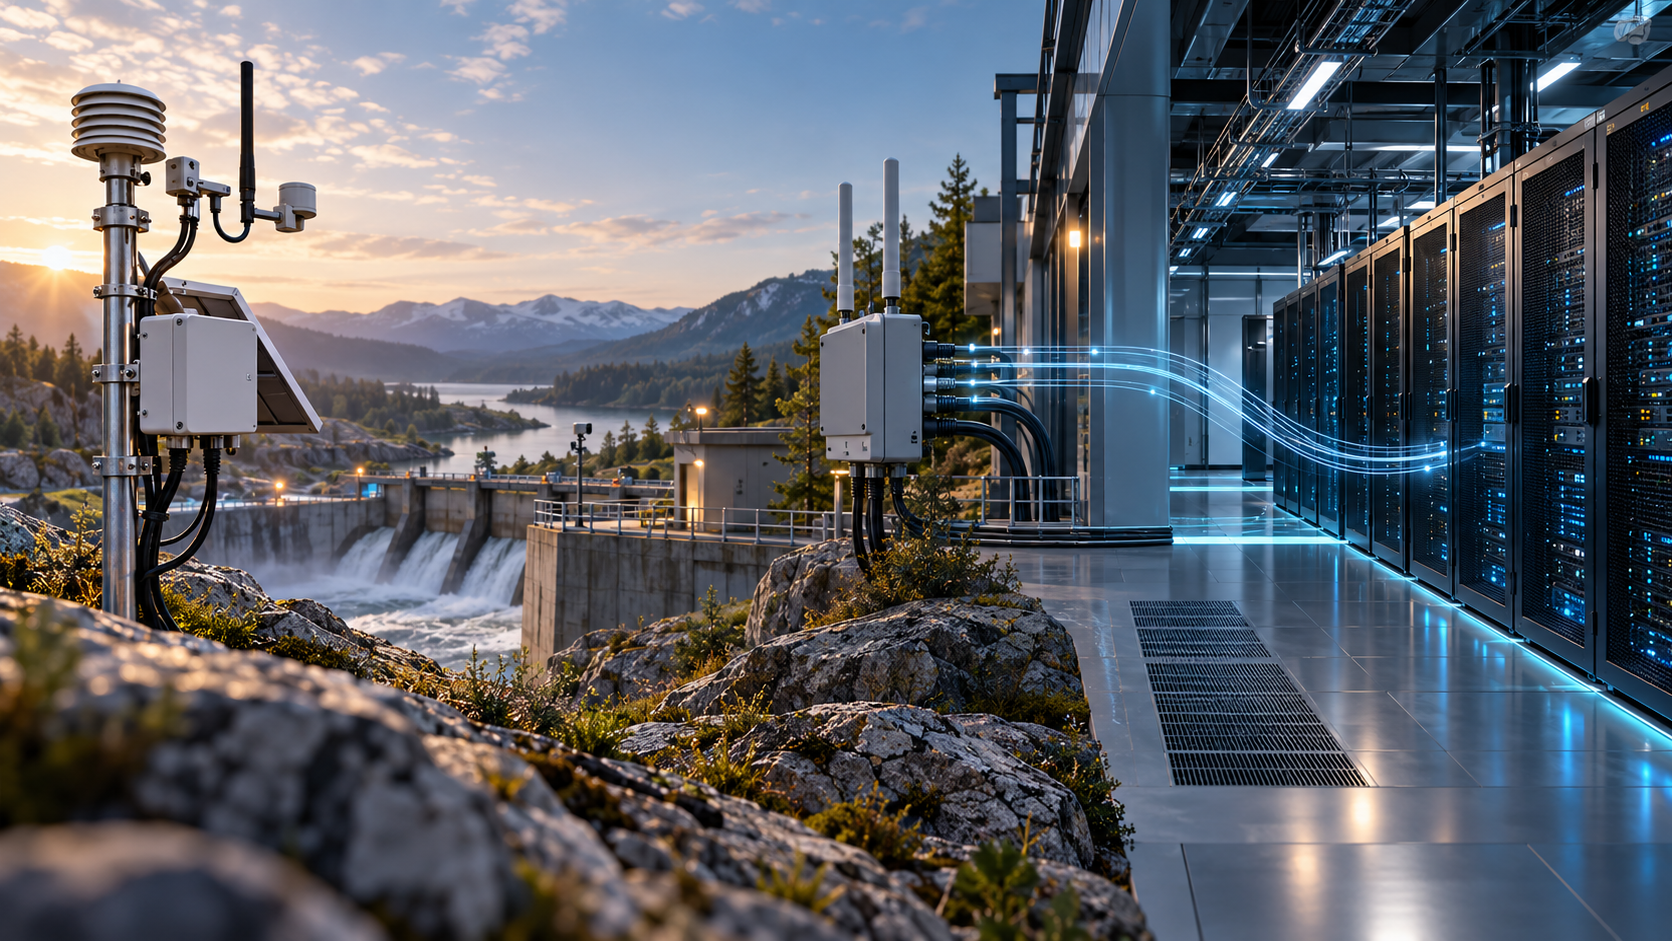
Monitoring a server in a data center and tracking a sensor installed on industrial equipment are activities that share important principles but face different operational conditions.
In the first scenario, the team generally has a known network, identifiable operating systems, management interfaces, and relatively controlled access to the environment. In the second, the asset may be miles away, depend on a battery, operate with intermittent connectivity, and remain exposed to heat, humidity, dust, or vibration.
This difference changes how information is collected, how unavailability is interpreted, how alerts are configured, and how failures are investigated.
That does not mean traditional Information Technology (IT) monitoring practices stop working. Asset inventory, availability indicators, event correlation, incident management, and historical analysis remain essential. What changes is how these principles are applied to devices that do not always stay connected, respond to queries, or expose detailed metrics.
IoT monitoring extends the traditional view of infrastructure to include the behavior of the physical device, the communication, and the reliability of the data produced in the field.
The starting point is different
In IT monitoring, the most common assets include physical and virtual servers, operating systems, databases, applications, network equipment, and infrastructure services. The team tracks metrics such as processor utilization, memory, disk space, latency, availability, and application errors.
Many of these components are centrally administered, have enough resources to run agents or expose management interfaces, and operate on networks designed to provide continuous communication.
In IoT, the monitored object may also be a small sensor, a smart meter, a tracker, an industrial controller, or a communication device installed in the field. These devices may have little processing power and memory, restricted diagnostic interfaces, and different power and connectivity conditions.
The National Institute of Standards and Technology (NIST) defines an IoT device by the combination of at least one sensor or actuator, which interacts with the physical world, and a network interface, which connects it to the digital world. The institute also recognizes that the device may depend on hubs, cloud services, or other systems to perform certain functions [1].
This combination of physical and digital components changes diagnosis.
When a server shows high memory utilization, the team can query operating system metrics, examine processes, and relate the behavior to application logs. When a remote sensor stops transmitting, perhaps only the times of the last messages, the measurement history, and a few indicators provided by the gateway are available.
In both cases there is a situation to investigate. The difference lies in the amount of evidence, the means to collect it, and the possibilities for intervention.
Collection does not always start in the monitoring system
An important difference lies in the model used to obtain information from assets.
In many IT architectures, the platform periodically queries a target to collect metrics. This model is known as pull: the central system initiates the request and the asset responds. Prometheus, for example, normally uses this model and cites among its advantages the ability to identify more clearly when a target stops responding [2].
In many IoT architectures, the flow starts at the device. It publishes a measurement or an event to a gateway, broker, or ingestion service, which forwards the message to interested systems.
MQTT is a message transport protocol based on the publish and subscribe model. A client publishes messages to topics, while other clients subscribe to the topics relevant to them in order to receive the messages. The specification also establishes that the format of the transported content is defined by the application [3].
This allows a sensor to send information when a scheduled measurement occurs, when an event arises, or when the connection is available, without requiring an individual query for each reading.
But the distinction is not absolute. IoT does not necessarily mean push communication, just as IT monitoring does not work exclusively by polling. Some IoT solutions use request and response. The Constrained Application Protocol (CoAP), standardized by the Internet Engineering Task Force (IETF), was designed for constrained nodes and networks and offers an interaction layer based on requests and responses [4].
The most important difference is not in choosing between pull and push, but in correctly interpreting the expected behavior of each asset.
Availability can have different meanings
A server that should respond continuously can be considered unavailable when it stops answering monitoring queries. For an IoT device, a period without communication may be part of normal operation.
Battery-powered sensors may stay in low-power mode part of the time. Meters may transmit at predetermined intervals. Trackers may store information locally when they lose connectivity and send it after the signal returns.
Consider a meter that sends a reading every 15 minutes. The absence of messages within that window does not necessarily represent a failure. If the platform generates alerts at intervals shorter than the normal transmission cycle, it will produce undue notifications. If it waits too long, a real interruption may remain invisible for a period incompatible with the application.
For this reason, monitoring needs to know the expected message frequency, the admissible latency, the possibilities of delay, the behavior during communication failures, and the recovery process when connectivity returns.
It is also necessary to distinguish three moments:
The time the measurement was taken.
The time the device or gateway transmitted the message.
The time the platform received and processed the information.
A gateway can forward data stored during an interruption. The delivery is recent, but the measurement may be old. Without this distinction, a dashboard can present delayed information as if it described the asset’s current condition.
In IoT, receiving a message now does not necessarily mean observing what is happening now.
The physical environment takes part in diagnosis
IT monitoring already tracks temperature, power, and physical conditions in data centers. Considering the environment is therefore not exclusive to IoT.
What changes is the variety of installation sites and the proximity between environmental conditions and the device’s operation.
A sensor may be installed on an industrial machine, inside an outdoor cabinet, near motors, in a rural area, or at a point subject to humidity, dust, and vibration. Electrical power, mounting, protective enclosure, and environmental exposure can affect both the device and its communication.
A single power failure can bring down a gateway and, as a consequence, make several sensors seem to disappear. A metal cabinet can interfere with signal propagation. Temperatures outside the manufacturer’s specifications can affect electronic components or batteries.
In addition, the variable the sensor measures does not always describe the internal condition of the device itself. The temperature of an industrial machine, for example, does not necessarily tell the temperature of the electronic components of the sensor installed on it.
Diagnosis must consider these relationships to avoid hasty conclusions and interventions on the wrong component.
The available evidence is more limited
Servers and applications normally offer metrics, logs, traces, remote access, and diagnostic tools. Even when the investigation is complex, the team usually has different sources of evidence.
Smaller IoT devices may provide only a reduced set of information. In some cases, there is no accessible operating system, enough storage to keep logs, or constant connectivity for a remote session.
Diagnosis then depends on what the architecture managed to preserve outside the device: last messages, signal quality, gateway state, battery indicators, configuration changes, and communication history.
This limitation makes the design of telemetry an important part of the project. If information needed to investigate failures is not collected during operation, it may be impossible to recover it after the incident.
The way of acting also changes. Remotely restarting a server can be simple in a managed infrastructure. Replacing a sensor in the field may require travel, physical access, a spare part, and coordination with local operations.
The lower the remote diagnostic capability, the greater the importance of collecting useful evidence before the device stops responding.
Identical protocols do not guarantee equivalent data
The IoT ecosystem brings together different protocols, manufacturers, models, and formats. One device may use MQTT, another may communicate over CoAP, and a third may depend on an industrial protocol or a gateway that converts its information for the central platform.
Even when two devices use the same protocol, their messages may have different structures and meanings. The MQTT specification defines how to transport messages but does not establish a universal model for the content. Units, field names, status codes, and conventions remain defined by applications [3].
A scalable monitoring architecture needs to identify each device and associate it with a reliable inventory. It must also normalize common attributes, such as manufacturer, model, location, and operational state, without eliminating the characteristics needed to understand each piece of equipment.
This normalization makes it possible to build a common view, but it does not turn all assets into identical objects. A battery level, a signal strength, and a fault code still require interpretation according to the manufacturer, the model, and the function performed.
What remains valid from IT experience
The particularities of IoT require adaptations, but they do not justify discarding established infrastructure management practices.
Inventory remains essential. In IoT, it needs to include information such as model, firmware, location, connectivity, power supply, associated gateway, and the application that uses the data.
Indicators and baselines also remain necessary. The difference is that thresholds must reflect each device’s operating cycle. A server that responds continuously follows different criteria than a sensor that transmits in specific periods.
Event correlation helps prevent related symptoms from being handled in isolation. If several sensors connected to the same gateway stop transmitting at the same time, the shared infrastructure should be investigated before assuming independent failures in all the equipment.
Incident management processes remain valid. Prioritization, assignment, escalation, and closure are still necessary, but tickets need to include information suited to the physical environment, such as the last measurement, the time of receipt, the associated gateway, and the asset’s location.
Automation and historical analysis also keep their value. They can group occurrences, classify events, route tickets, and reveal recurring patterns, provided they respect the limitations of devices and networks.
The central principle is simple: traditional practices must be adapted, not applied indiscriminately.
An integrated architecture needs to observe four layers
In most organizations, IoT and IT do not form independent environments. A connected solution depends on gateways, networks, brokers, servers, databases, processing services, and enterprise applications.
For this reason, an integrated view needs to track four related layers.
Infrastructure and central services
Servers, virtual machines, networks, databases, brokers, APIs, and ingestion services must remain under traditional IT monitoring. A failure in this layer can affect several devices, even when all of them keep working in the field.
Devices and communication
Tracking must consider the last message, transmission frequency, connection quality, energy state, and the specific metrics offered by the equipment.
Data quality and freshness
It is not enough to confirm that a message arrived. It is necessary to verify whether the measurement belongs to the expected interval, whether it remains consistent, and whether it follows the rules defined for the application.
Correlation and operational response
Events from the different layers need to be related. The goal is to recognize dependencies, reduce fragmented diagnoses, and route each occurrence to the responsible team with as much context as available.
This integration prevents devices, communication, and infrastructure from being treated as isolated universes. It also makes it possible to distinguish a local failure from a shared problem that affects the entire chain.
Expanding visibility over the connected environment
IoT monitoring and IT monitoring share foundations but deal with different operational conditions.
Devices installed in the field may transmit periodically, depend on intermittent connectivity, enter low-power mode, and offer few diagnostic resources. They are also subject to physical conditions that influence their operation and produce data that must be interpreted according to the application context.
These characteristics do not invalidate the experience accumulated in infrastructure. Inventory, indicators, event correlation, incident management, automation, and historical analysis remain fundamental.
For organizations that maintain distributed connected assets, the most consistent approach is to integrate the visibility of central infrastructure with the operational condition of devices in the field. This makes it possible to investigate failures considering the dependencies among sensors, communication, gateways, platforms, and applications.
Monitoring IoT means expanding the ability to see the connected physical environment and relate it to the digital services it depends on.
About Target Solutions
Target Solutions has spent more than 15 years helping organizations evolve their infrastructure, monitoring, observability, automation, and operational intelligence operations. Across that journey, it has participated in projects in complex environments such as telecom, technology, government, energy, and large enterprises, helping increase operational efficiency and service reliability.
That experience also includes Internet of Things (IoT) projects, where connectivity, technical integration, and operational follow-up matter to turn connected devices into useful solutions for organizations.
About the author
Paulo Florêncio de Menezes is cofounder of Target Solutions and has spent more than 15 years on projects involving infrastructure, monitoring, observability, automation, and IT and telecom operations.
He holds a degree in data processing from the Federal University of Amazonas (UFAM), an MBA in business management from Fundação Dom Cabral (FDC), and a professional master’s in economics from Fundação Getulio Vargas (FGV).
In his master’s research, he developed the IBEOP-IA (Brazilian Index of Occupational Exposure Potential to Artificial Intelligence), studying the potential exposure of Brazilian occupations to AI capabilities by combining occupational data, artificial intelligence patents, and natural language processing techniques.
References
[1] NATIONAL INSTITUTE OF STANDARDS AND TECHNOLOGY. Frequently Asked Questions: NIST Cybersecurity for IoT Program.
[2] PROMETHEUS AUTHORS. Frequently asked questions: Why do you pull rather than push? Official Prometheus documentation.
[3] OASIS. MQTT Version 5.0. OASIS Standard, 7 Mar. 2019.
[4] SHELBY, Zach; HARTKE, Klaus; BORMANN, Carsten. The Constrained Application Protocol (CoAP). RFC 7252. Internet Engineering Task Force, Jun. 2014.